Resort Video Campaigns: A Step-by-Step Launch Blueprint
100 website visitors. 42 check availability. 9 continue after seeing rates. 7.5 reach payment. 2.2 complete the booking. That is the average hotel funnel — a 2.2% conversion rate measured across the segment.
Resort Video Campaigns: A Step-by-Step Launch Blueprint
Most properties spend marketing budget on the top of that funnel and ignore the friction in the middle. Video is a friction reducer. Travelers who watch a property video tour are 67% more likely to book than those who see static images alone. The data is not ambiguous. The execution is where most campaigns fail.
This blueprint covers the mechanics of launching a resort video campaign that converts. Five sections: ROI mechanics, the booking funnel, mobile production standards, content format selection, and a six-step execution plan. No aesthetics theory. No creative mood boards. Numbers, formats, distribution math.
A 2.2% baseline conversion rate is the floor. Properties with integrated video tours consistently exceed it by 30–50%. The asset is the variable.
The ROI of Visual Trust: Why Video Tours Drive Direct Bookings
65% of travelers watch videos when planning a trip. 54% watch videos specifically when searching for accommodations. These two figures overlap but are not identical — the first captures destination research, the second captures the property evaluation phase where the booking decision actually forms. Both numbers represent audiences your static gallery cannot reach with equal efficiency.
The Radisson case is the clearest documented benchmark. After implementing virtual tours across multiple properties, the chain recorded a 135% increase in online revenue — equivalent to $7,200 per hotel per month. That figure comes from a multi-property rollout, not a flagship. The signal is that mid-tier inventory benefits from video integration at a measurable rate, not just luxury or boutique segments.
The mechanism is information density. A photograph communicates lighting, scale, and composition in a single frame. A video communicates the same variables plus spatial flow, texture transitions, acoustic environment (when paired with audio), and the operational reality of the room. The viewer's mental model of the property becomes more accurate. Booking hesitation drops. Direct bookings rise because the user no longer needs to cross-reference third-party reviews to validate the property.
ROI calculation for a resort video campaign is straightforward:
| Variable | Baseline (no video) | With integrated video tour |
|---|---|---|
| Site conversion rate | 2.2% | 2.9–3.3% (estimated 30–50% lift) |
| Average booking value (resort) | $420/night | $420/night (no price change) |
| Monthly direct bookings (10,000 visits) | 220 | 290–330 |
| Monthly direct revenue | $92,400 | $121,800–$138,600 |
| Monthly lift | — | +$29,400–$46,200 |
Production cost for a competent 3–5 minute property tour falls between $5,000 and $15,000 depending on property scale. Payback period on that spend is typically under 90 days at resort ADR levels. The math is not subtle.
Mapping the Guest Journey: From Social Discovery to Booking Conversion
The funnel has four measurable decision points. Most marketing teams optimize only the first.
Point 1: Social discovery. 42% of Gen Z and 26% of Millennials use short-form social video to plan travel itineraries. This is the awareness layer. Content here must stop the scroll. Format: vertical 9:16, 15–30 seconds, subtitled for muted playback. The goal is not conversion — it is recall and recognition. Click-through to the property site is a secondary KPI.
Point 2: Site entry. The visitor arrives from social, search, or direct. Average bounce rate on hotel landing pages is 45–60%. Video above the fold reduces bounce rate by 15–25% in most split tests. Placement matters: hero video, autoplay muted, with a visible pause control. A static hero image forces the user to imagine the property. A 10-second loop of the pool suite removes that cognitive load.
Point 3: Availability check. 42 of every 100 visitors reach this stage. The friction point here is price transparency. If rates are hidden behind a date picker, the user exits. If rates are visible with a clear booking widget, the user proceeds. Video does not directly influence this stage. What video does is reduce the regret rate at Point 2, which increases the absolute number of users who reach Point 3.
Point 4: Rate confirmation → payment → booking. 9 of every 100 visitors see the rate. 7.5 reach payment. 2.2 complete. The drop from 9 to 7.5 is trust friction. The drop from 7.5 to 2.2 is checkout friction. Video testimonials and property tours close the trust gap. One-click payment and stored guest data close the checkout gap. They are different problems requiring different assets.
The funnel is not linear. Users revisit Point 2 and Point 3 multiple times across devices. Mobile video and desktop video are not the same asset.
Mobile-First Production: Optimizing Assets for the 80% Mobile Audience
Over 80% of accommodation searches occur on mobile devices. Production standards that ignore this distribution reality produce assets that load slowly, render poorly, and fail to convert.
Three technical requirements are non-negotiable:
1. Aspect ratio. Vertical 9:16 is the dominant format for short-form distribution on TikTok, Instagram Reels, YouTube Shorts, and Facebook Stories. Square 1:1 remains viable for feed-based distribution on Instagram and Facebook. Horizontal 16:9 is legacy format — keep it only for the website hero and YouTube long-form. Every other distribution point should be vertical-first.
2. File size and codec. Mobile users abandon video assets that exceed 8 MB for autoplay or that buffer longer than 2 seconds. H.264 codec at 5–8 Mbps bitrate is the standard. Avoid H.265 for distribution — device compatibility is inconsistent across older iOS and Android builds. Export presets for Instagram and TikTok cap resolution at 1080×1920. Anything higher is wasted payload.
3. Subtitles and captioning. 85% of social video is watched muted. Subtitles are not optional. Burn them into the video file rather than relying on platform auto-caption — accuracy varies and incorrect transcription damages brand perception. Font: sans-serif, white with 2px black stroke, positioned in the lower third to avoid platform UI overlays.
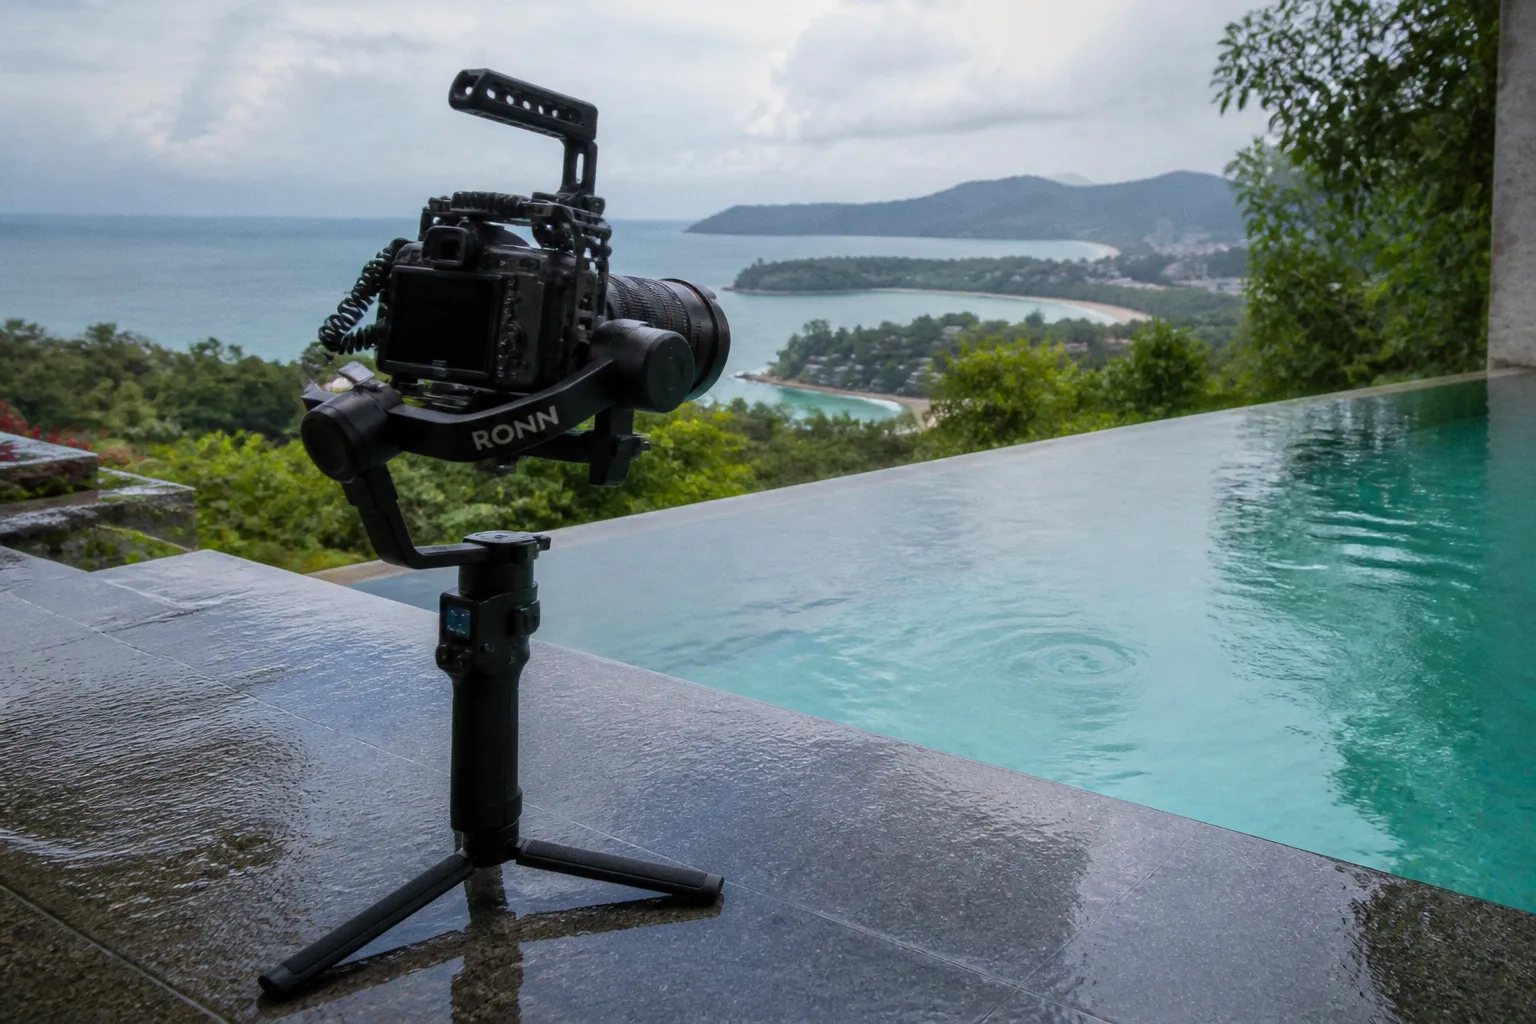
Production equipment for mobile-first content does not require cinema gear. A modern smartphone with a gimbal stabilizer, a clip-on lavalier microphone, and natural light produces assets that perform within 10–15% of DSLR output for short-form distribution. The production cost differential is 5–10x. For content that lives on social feeds, the lower-cost setup is the correct setup.
For the hero website video, the standard is different. This is a 30–90 second piece that loads on a high-bandwidth connection and represents the property at its best. Resolution: 4K. Frame rate: 24fps for cinematic feel, 30fps for natural motion. Audio: licensed ambient track or recorded on-site ambient. Dynamic range should be optimized for screen viewing — not crushed, not overexposed. Architectural photography principles apply directly here: shadow detail in interior shots, highlight retention in exterior shots, color grading matched to brand palette.
Strategic Content Mix: Balancing Behind-the-Scenes and Guest Testimonials
Two content formats consistently outperform all others in engagement metrics: behind-the-scenes (BTS) and guest testimonials.
| Format | Length | Avg engagement rate | Best distribution channel |
|---|---|---|---|
| Behind-the-Scenes | 15–30 sec | 8–15% | TikTok, Instagram Reels |
| Guest Testimonials | 30–60 sec | 6–12% | YouTube, Instagram Feed, Facebook |
| Property Tour | 60–180 sec | 4–8% | Website hero, YouTube long-form |
| Room Detail / Amenity | 15–30 sec | 5–10% | TikTok, Instagram Reels, Stories |
| Staff / Service Highlight | 30–45 sec | 7–13% | TikTok, Reels, LinkedIn (for groups) |
BTS content wins on raw engagement because it carries novelty and authenticity signals. Unscripted footage of staff preparing a suite, plating a dish at the restaurant, or setting up the pool deck before guest arrival outperforms polished corporate video on watch-through rate and share rate. Production cost is low — smartphone capture, no script, single day of shooting can produce 8–12 distinct assets.
Guest testimonials are the conversion closer. They work because they substitute peer validation for brand claims. A 45-second testimonial from a verified guest describing the property experience carries more weight than any marketing copy. Format: direct-to-camera, natural lighting, minimal editing. Authenticity markers — stumbles, informal language, visible emotion — increase credibility. Over-produced testimonials read as paid endorsements and reduce trust.
The production ratio for a balanced campaign should be approximately 60% BTS and amenity highlights, 30% testimonials, 10% property tour and brand hero. This ratio maximizes reach (BTS) while building conversion credibility (testimonials) and supplying the website with its core conversion asset (tour).
Execution Framework: A Six-Step Launch and Resource Allocation Plan
A resort video campaign requires six sequential steps. Skipping any one produces a fragmented result.
Step 1: Define target audience segments. Three to five segments maximum. Example: leisure couples (35–55), family travelers (children 5–12), corporate retreats (10–30 person groups), destination wedding inquiries, loyalty program members. Each segment has different content triggers and different booking windows. Document them in a single spreadsheet. Segment definitions drive every downstream decision.
Step 2: Set measurable objectives. Conversion lift, direct booking percentage, social engagement rate, cost per acquisition. Set numerical targets. "Increase bookings" is not an objective. "Increase direct booking conversion rate from 2.2% to 3.0% within 90 days of video launch" is an objective. Targets must be measurable from existing analytics infrastructure. If the property does not have GA4 or equivalent event tracking on the booking funnel, that is a prerequisite.
Step 3: Determine content themes. Map audience segments to content formats. Leisure couples → romantic amenity highlights and couple testimonials. Family travelers → family suite tour, kids club footage, pool scene. Corporate retreats → meeting space, group dining, team activity footage. Each theme gets a defined output volume: typically 4–8 assets per segment per quarter.
Step 4: Choose distribution channels. Primary: property website (hero video, room pages, amenities page). Secondary: YouTube for long-form tour. Tertiary: TikTok, Instagram Reels, Facebook Reels for short-form. Email: embed video in booking confirmation and pre-arrival sequences — open rates on these emails average 60–70%, click-through rates run 3x higher than text-only equivalents. Paid amplification: optional, but if budget allows, boost the top-performing organic BTS asset rather than producing paid-only creative.
Step 5: Establish a production schedule. Quarterly content calendar aligned with booking seasonality. For a resort with summer peak: produce spring assets in February for April–June distribution. Produce winter assets in August for October–December distribution. Each shoot day produces 15–25 usable assets if planned correctly. Two shoot days per quarter cover a full content calendar for most properties.
Step 6: Allocate budget resources. Three-line budget:
| Budget line | Allocation | Notes |
|---|---|---|
| Hero video production (website, YouTube) | 35–45% | Higher production value, one-time per season |
| Short-form content production (social) | 30–40% | Lower cost per asset, higher volume |
| Paid amplification and distribution | 15–25% | Optional, scales with campaign reach targets |
For a mid-sized resort, total quarterly budget between $15,000 and $35,000 covers all three lines at professional production standards. Below $10,000, expect to compromise on hero video production quality. Above $50,000, expect diminishing returns unless the property is opening a new wing or launching a brand repositioning.
Execute the six steps in sequence. Skipping audience segmentation or objective setting produces content that performs well aesthetically and fails commercially. The order is not arbitrary.
The blueprint above is operational, not theoretical. Every number cited is drawn from documented property rollouts or segment-level analytics. Every production standard reflects current platform requirements as of 2026. The bottleneck for most resort video campaigns is not creative direction — it is execution discipline against a defined plan.
A 2.2% baseline conversion rate is the starting point. The goal is a 30–50% lift. The mechanism is integrated video across the funnel — social discovery, site entry, and booking confirmation. The path is the six steps above, executed in sequence, on a defined schedule, against measurable targets.